Correctness speaker average
41.7% passed tests (5 passed / 7 failed).
Class Proportion Mean Absolute Error
Data |
anger |
happiness |
neutral |
sadness |
|---|---|---|---|---|
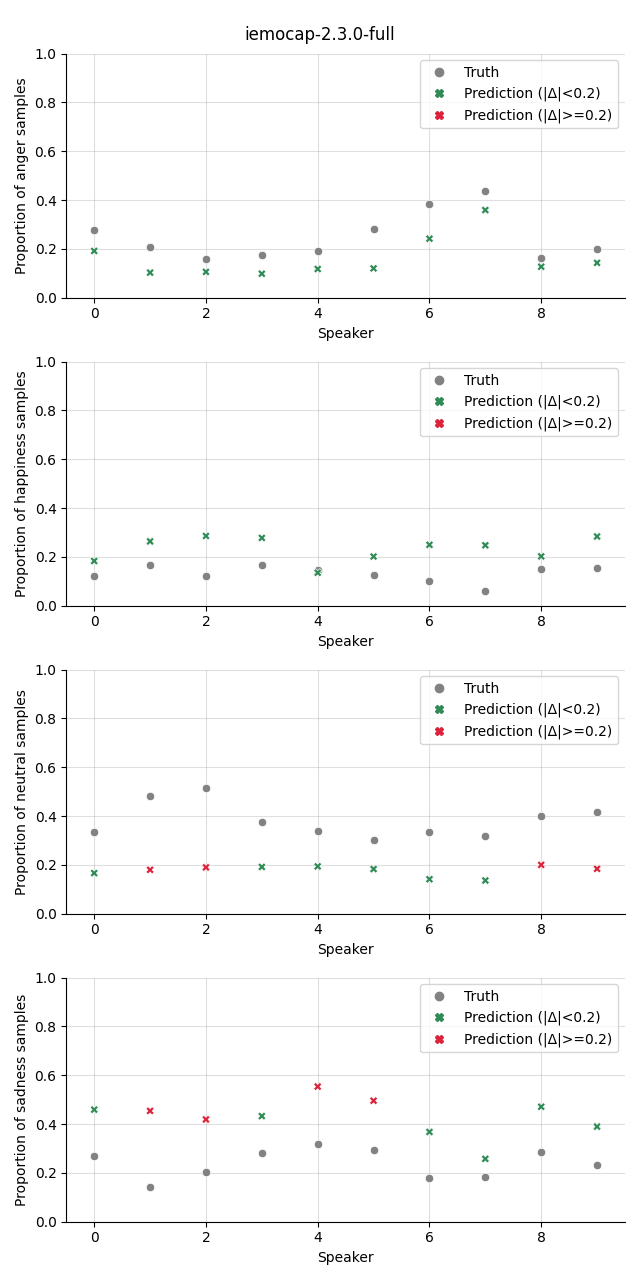
iemocap-2.3.0-full |
0.09 |
0.10 |
0.21 |
0.19 |
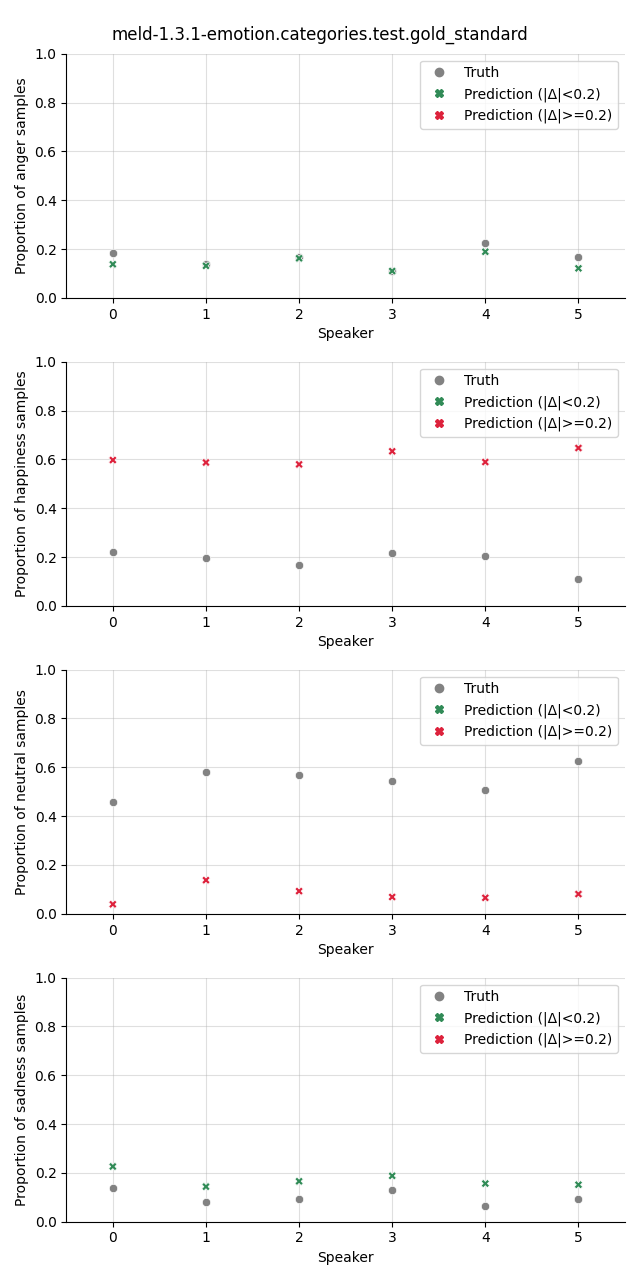
meld-1.3.1-emotion.categories.test.gold_standard |
0.02 |
0.42 |
0.47 |
0.07 |
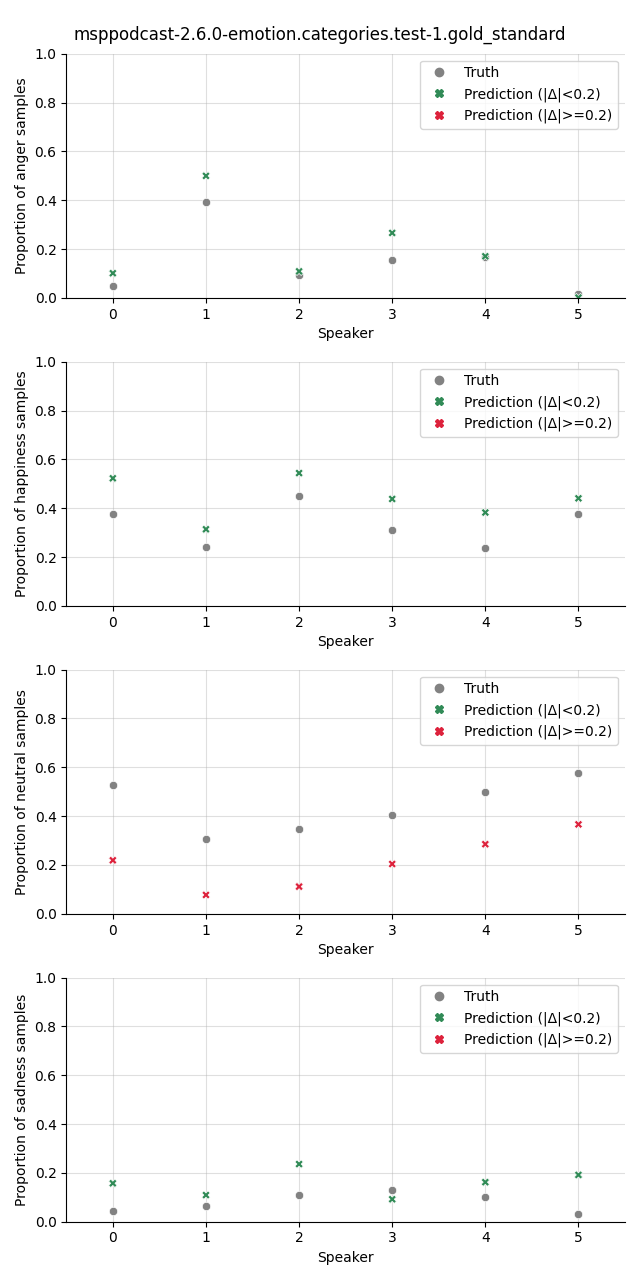
msppodcast-2.6.0-emotion.categories.test-1.gold_standard |
0.05 |
0.11 |
0.23 |
0.09 |
mean |
0.05 |
0.21 |
0.30 |
0.12 |
Visualization
The plot shows the proportion of the predicted samples for each class, as well as the true proportion of the class. We select a slightly higher threshold for the absolute error in the plots compared to the Class Proportion Difference test as we are interested in highlighting only big deviations here.


