Correctness speaker ranking
100.0% passed tests (2 passed / 0 failed).
Spearmans Rho
Data |
Spearmans Rho |
|---|---|
msppodcast-2.6.1-emotion.dimensions.test-1.gold_standard |
0.91 |
msppodcast-2.6.1-emotion.dimensions.test-2.gold_standard |
0.86 |
mean |
0.89 |
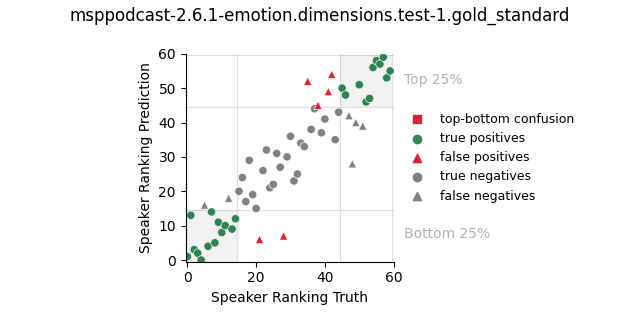
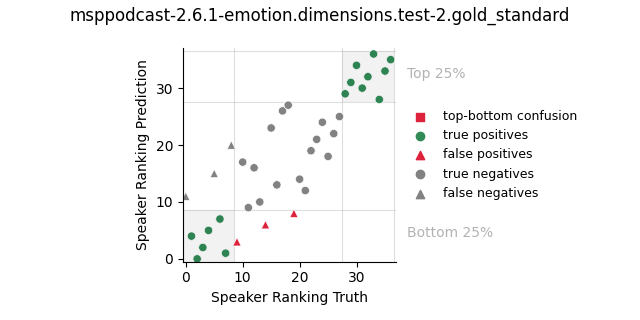
Visualization
The plots visualize the precision of predicting speakers to be in the Top 25% or Bottom 25% of all speakers. Green dots indicate correctly classified speakers, red false positive speakers, whereby red squares indicate confusions between Top 25% and Bottom 25% speakers. The remaining grey data points are samples outside the range of interest. They contain false negatives that should have been predicted in the Top 25% or Bottom 25% of speakers, but were not. True negatives are those speakers that are not part of the Top 25% or Bottom 25%, and were predicted as such.