Correctness consistency
19.1% passed tests (9 passed / 38 failed).
Samples In Expected High Range
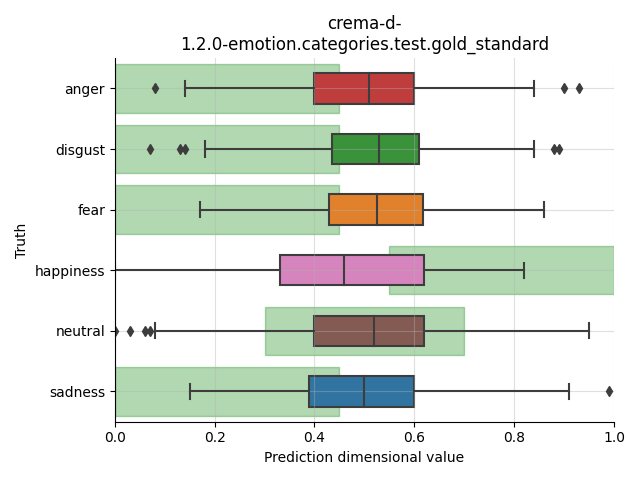
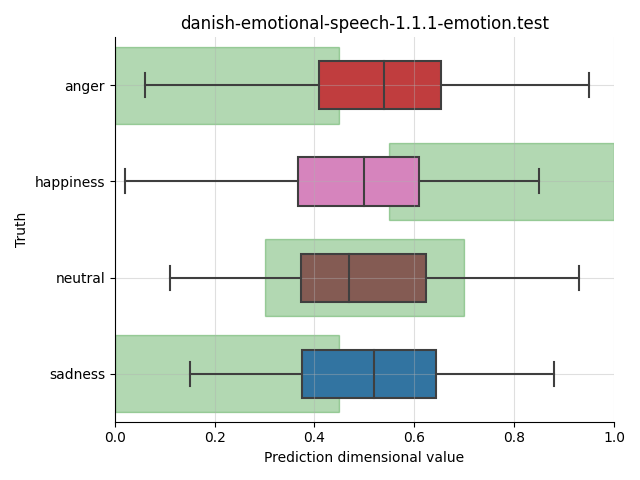
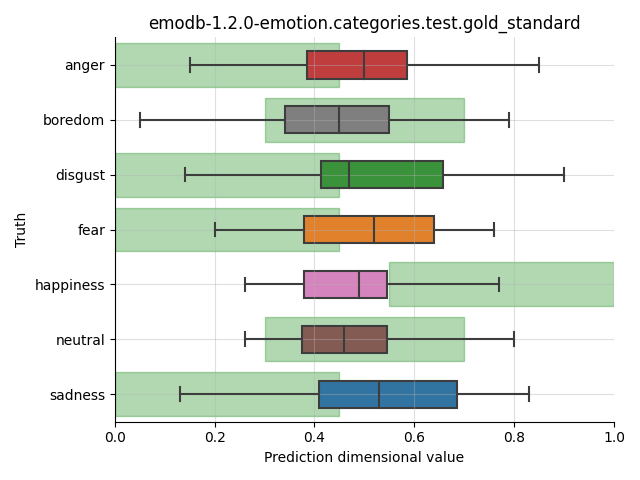
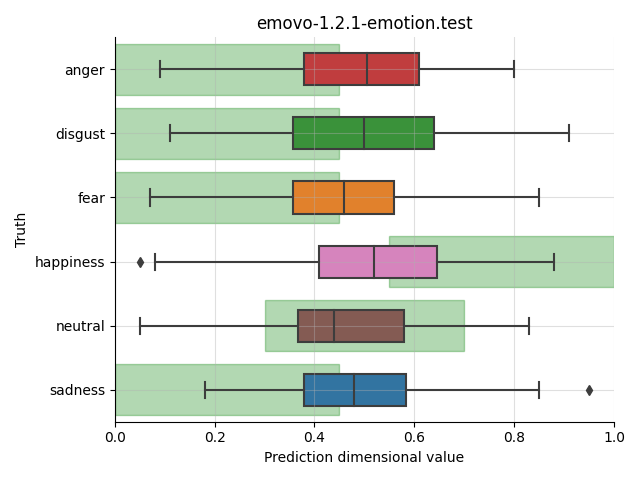
Proportion of samples whose predictions fall into the expected value range of >= 0.55
Data |
happiness |
|---|---|
crema-d-1.2.0-emotion.categories.test.gold_standard |
0.42 |
danish-emotional-speech-1.1.1-emotion.test |
0.42 |
emodb-1.2.0-emotion.categories.test.gold_standard |
0.26 |
emovo-1.2.1-emotion.test |
0.42 |
iemocap-2.3.0-emotion.categories.test.gold_standard |
0.42 |
meld-1.3.1-emotion.categories.test.gold_standard |
0.42 |
polish-emotional-speech-1.1.1-emotion.categories.test.gold_standard |
0.28 |
ravdess-1.1.2-emotion.speech.test |
0.31 |
mean |
0.37 |
Samples In Expected Low Range
Proportion of samples whose predictions fall into the expected value range of <= 0.45
Data |
anger |
disgust |
fear |
frustration |
sadness |
|---|---|---|---|---|---|
crema-d-1.2.0-emotion.categories.test.gold_standard |
0.35 |
0.27 |
0.35 |
0.41 |
|
danish-emotional-speech-1.1.1-emotion.test |
0.35 |
0.44 |
|||
emodb-1.2.0-emotion.categories.test.gold_standard |
0.40 |
0.50 |
0.33 |
0.37 |
|
emovo-1.2.1-emotion.test |
0.40 |
0.38 |
0.48 |
0.45 |
|
iemocap-2.3.0-emotion.categories.test.gold_standard |
0.35 |
0.47 |
0.38 |
0.44 |
|
meld-1.3.1-emotion.categories.test.gold_standard |
0.34 |
0.28 |
0.36 |
0.37 |
|
polish-emotional-speech-1.1.1-emotion.categories.test.gold_standard |
0.48 |
0.38 |
0.32 |
||
ravdess-1.1.2-emotion.speech.test |
0.44 |
0.44 |
0.41 |
0.31 |
|
mean |
0.39 |
0.37 |
0.40 |
0.38 |
0.39 |
Samples In Expected Neutral Range
Proportion of samples whose predictions fall into the expected value range of [0.3, 0.6]
Data |
boredom |
neutral |
|---|---|---|
crema-d-1.2.0-emotion.categories.test.gold_standard |
0.80 |
|
danish-emotional-speech-1.1.1-emotion.test |
0.71 |
|
emodb-1.2.0-emotion.categories.test.gold_standard |
0.78 |
0.81 |
emovo-1.2.1-emotion.test |
0.80 |
|
iemocap-2.3.0-emotion.categories.test.gold_standard |
0.76 |
|
meld-1.3.1-emotion.categories.test.gold_standard |
0.79 |
|
polish-emotional-speech-1.1.1-emotion.categories.test.gold_standard |
0.78 |
0.78 |
ravdess-1.1.2-emotion.speech.test |
0.88 |
|
mean |
0.78 |
0.79 |
Visualization
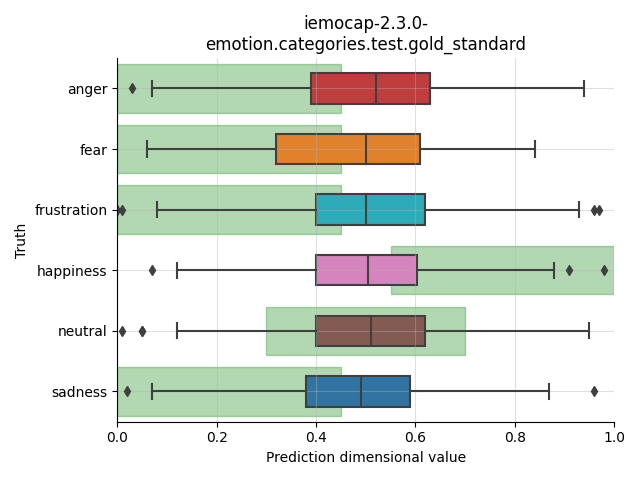
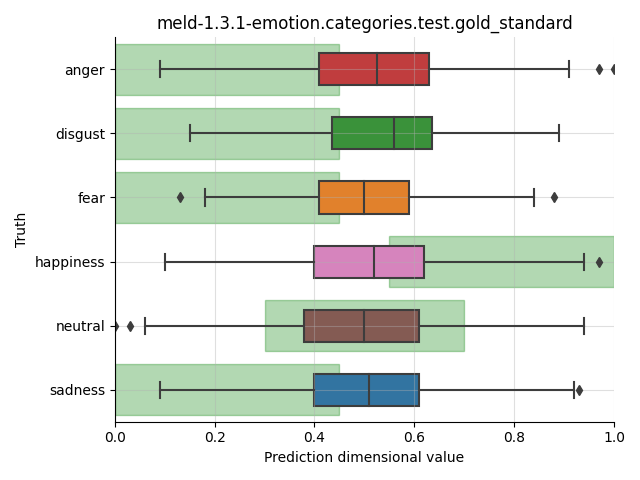
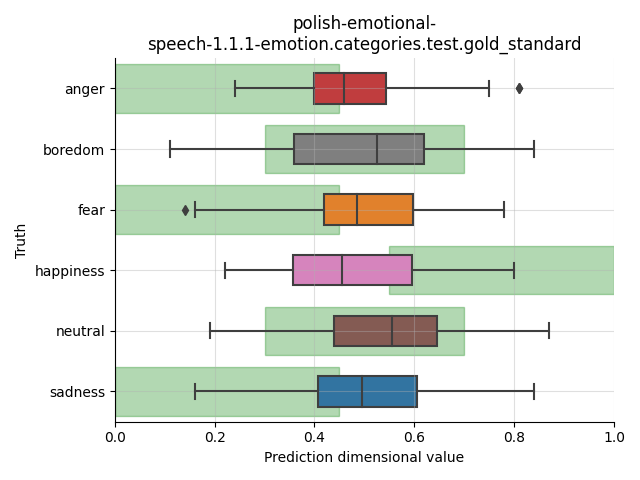
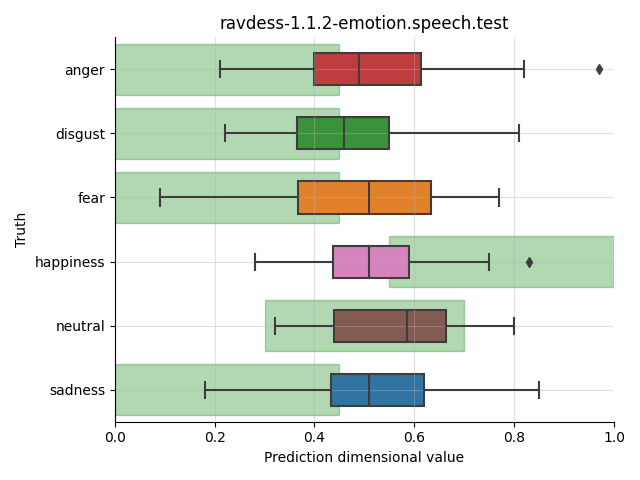
Distribution of dimensional model predictions for samples with different categorical emotions. The expected range of model predictions is highlighted by the green brackground.
