Robustness spectral tilt
62.5% passed tests (5 passed / 3 failed).
Change Ccc Downward Tilt
Data |
Change CCC Downward Tilt |
|---|---|
iemocap-2.3.0-emotion.dimensions.test.gold_standard |
-0.01 |
msppodcast-2.6.1-emotion.dimensions.test-1.gold_standard |
-0.02 |
mean |
-0.01 |
Change Ccc Upward Tilt
Data |
Change CCC Upward Tilt |
|---|---|
iemocap-2.3.0-emotion.dimensions.test.gold_standard |
0.03 |
msppodcast-2.6.1-emotion.dimensions.test-1.gold_standard |
0.01 |
mean |
0.02 |
Percentage Unchanged Predictions Downward Tilt
Data |
Percentage Unchanged Predictions Downward Tilt |
|---|---|
iemocap-2.3.0-emotion.dimensions.test.gold_standard |
0.83 |
msppodcast-2.6.1-emotion.dimensions.test-1.gold_standard |
0.68 |
mean |
0.76 |
Percentage Unchanged Predictions Upward Tilt
Data |
Percentage Unchanged Predictions Upward Tilt |
|---|---|
iemocap-2.3.0-emotion.dimensions.test.gold_standard |
0.44 |
msppodcast-2.6.1-emotion.dimensions.test-1.gold_standard |
0.46 |
mean |
0.45 |
Visualization Downward Tilt
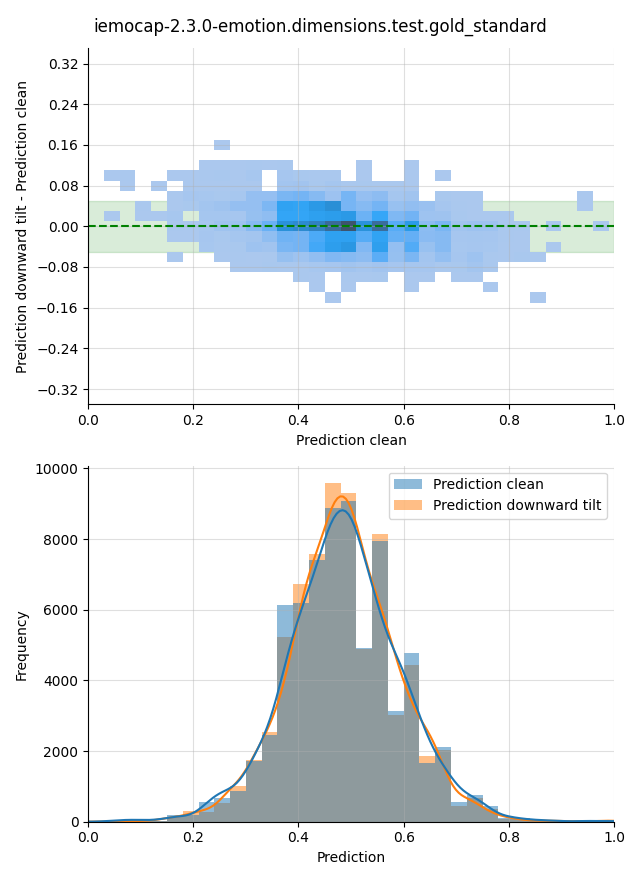
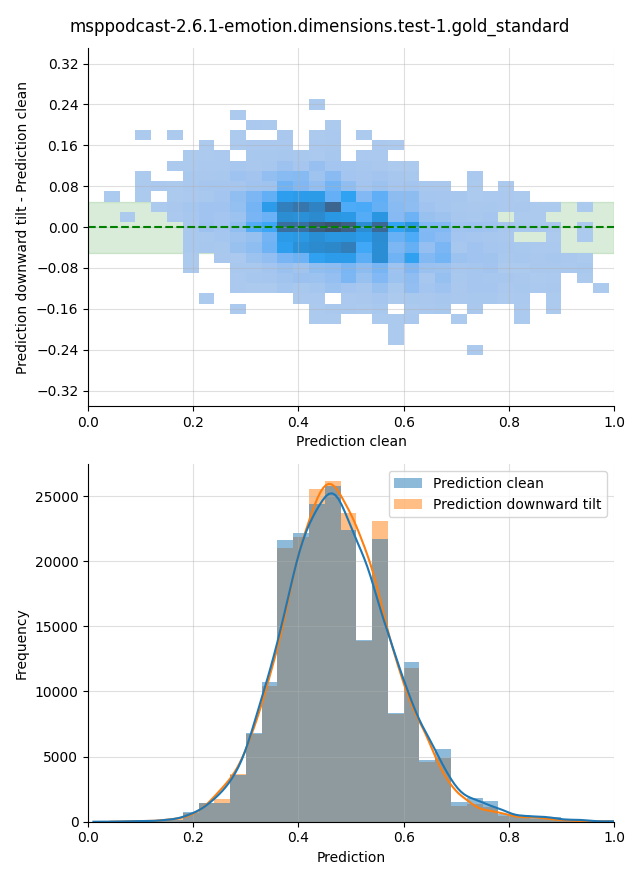
Difference of predictions for original audio and audio with a downward spectral tilt. The allowed prediction difference \(\delta < 0.05\) is highlighted in green in the upper plot. The lower plot shows the distributions of the two predictions.


Visualization Upward Tilt
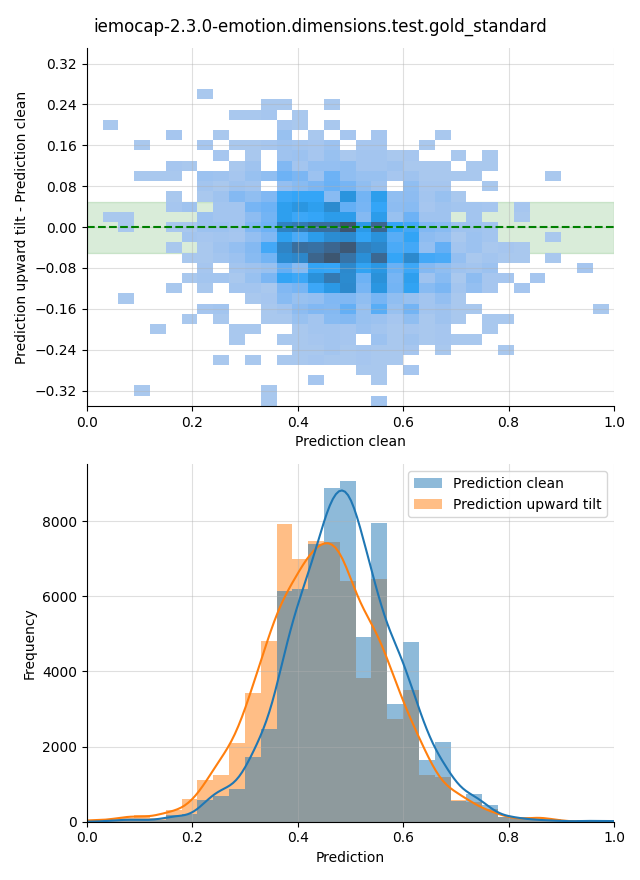
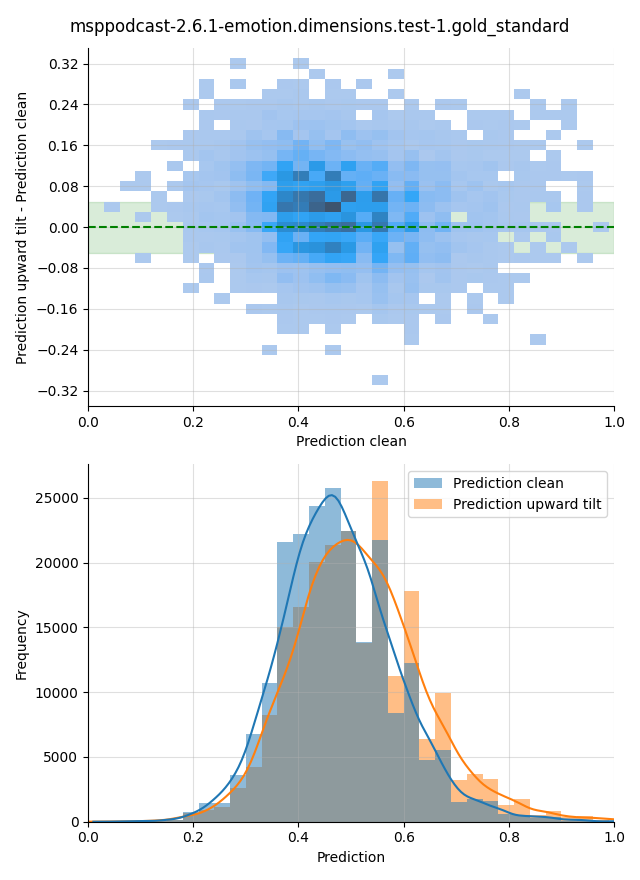
Difference of predictions for original audio and audio with an upward spectral tilt. The allowed prediction difference \(\delta < 0.05\) is highlighted in green in the upper plot. The lower plot shows the distributions of the two predictions.

