Robustness low quality phone
0.0% passed tests (0 passed / 4 failed).
Change Ccc Low Quality Phone
Data |
Change CCC Low Quality Phone |
|---|---|
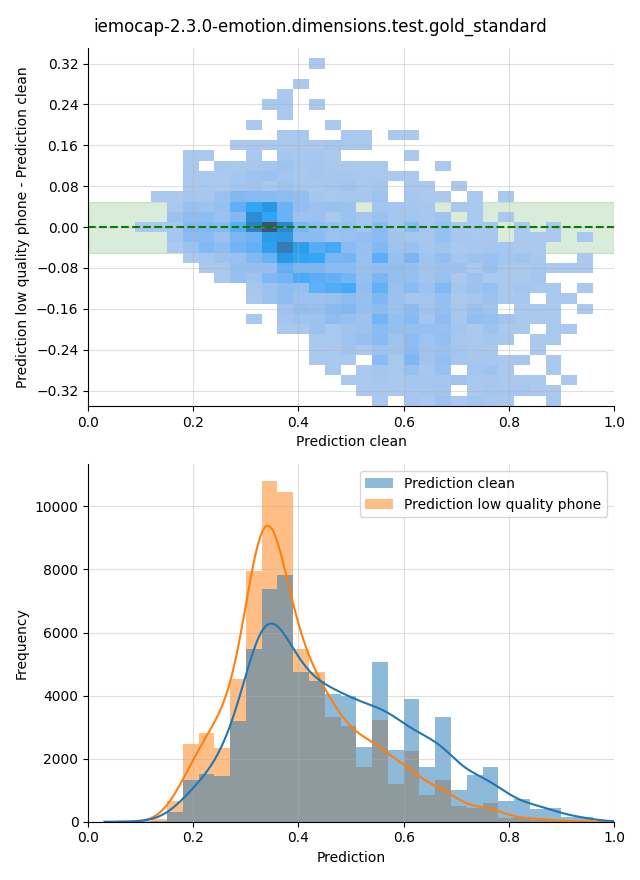
iemocap-2.3.0-emotion.dimensions.test.gold_standard |
-0.10 |
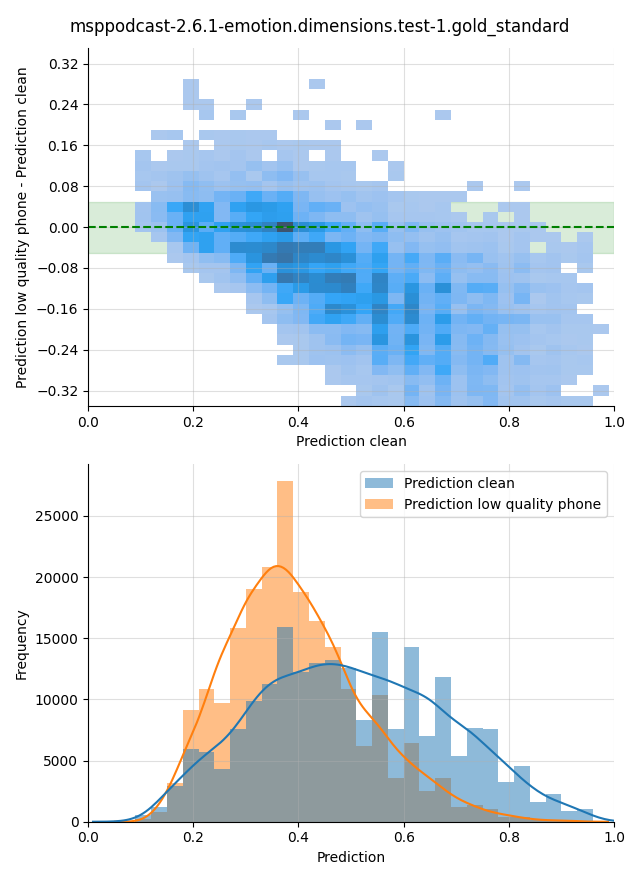
msppodcast-2.6.1-emotion.dimensions.test-1.gold_standard |
-0.24 |
mean |
-0.17 |
Percentage Unchanged Predictions Low Quality Phone
Data |
Percentage Unchanged Predictions Low Quality Phone |
|---|---|
iemocap-2.3.0-emotion.dimensions.test.gold_standard |
0.42 |
msppodcast-2.6.1-emotion.dimensions.test-1.gold_standard |
0.29 |
mean |
0.35 |
Visualization
Difference of predictions for original audio and low quality phone audio. The allowed prediction difference \(\delta < 0.05\) is highlighted in green in the upper plot. The lower plot shows the distributions of the two predictions.