Robustness simulated recording condition
0.0% passed tests (0 passed / 6 failed).
Percentage Unchanged Predictions Simulated Position
Data |
Percentage Unchanged Predictions Simulated Position |
|---|---|
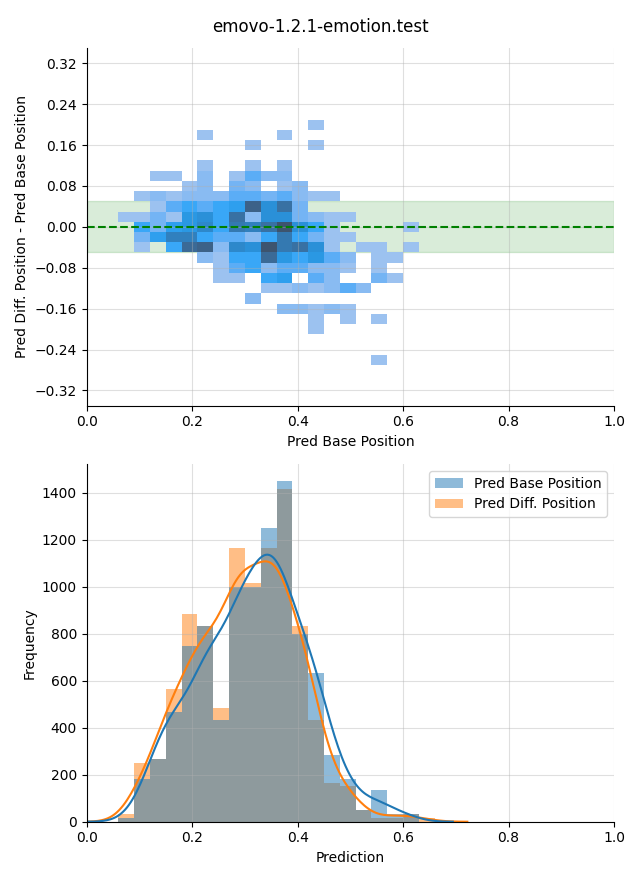
emovo-1.2.1-emotion.test |
0.68 |
imda-nsc-read-speech-balanced-2.6.0-headset |
0.60 |
timit-1.4.1-files |
0.58 |
mean |
0.62 |
Percentage Unchanged Predictions Simulated Room
Data |
Percentage Unchanged Predictions Simulated Room |
|---|---|
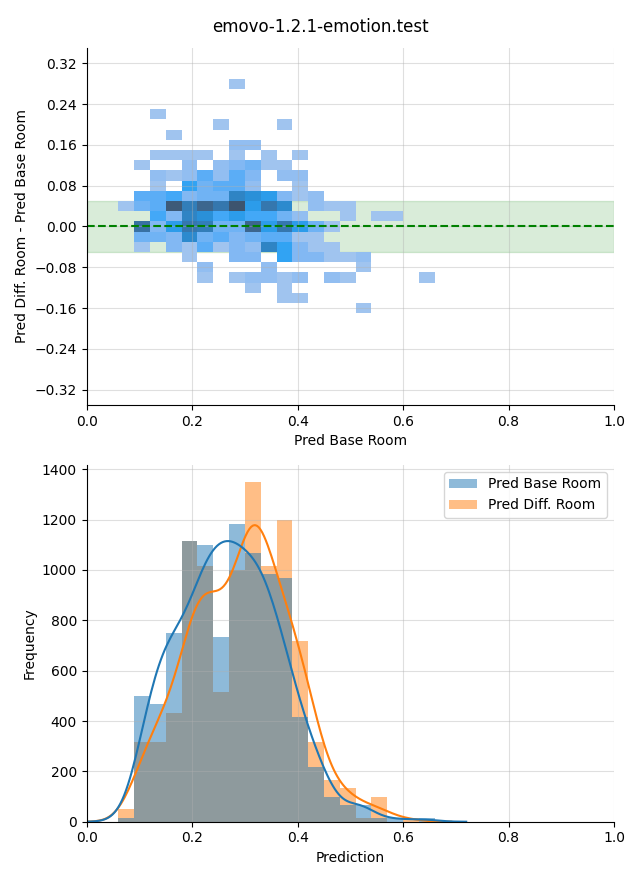
emovo-1.2.1-emotion.test |
0.68 |
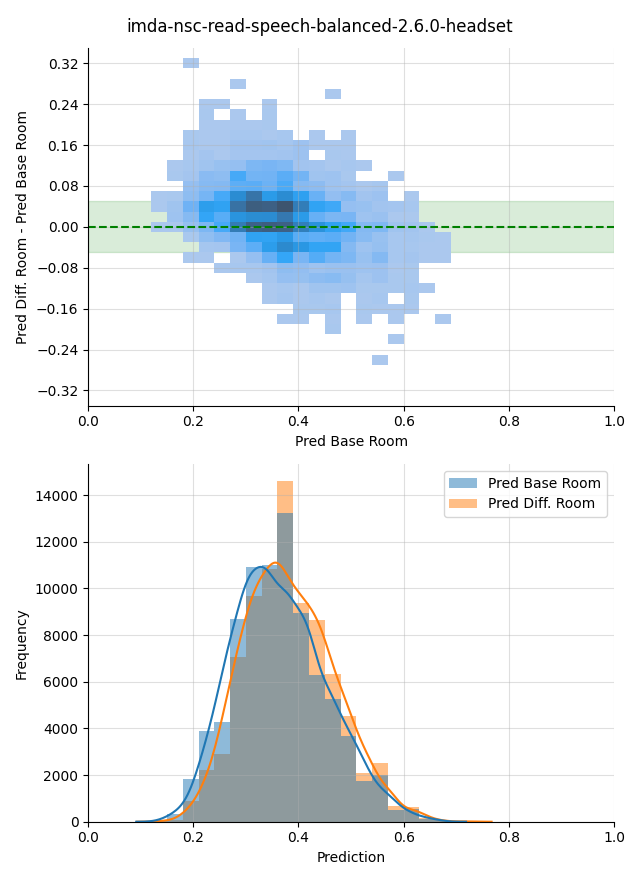
imda-nsc-read-speech-balanced-2.6.0-headset |
0.64 |
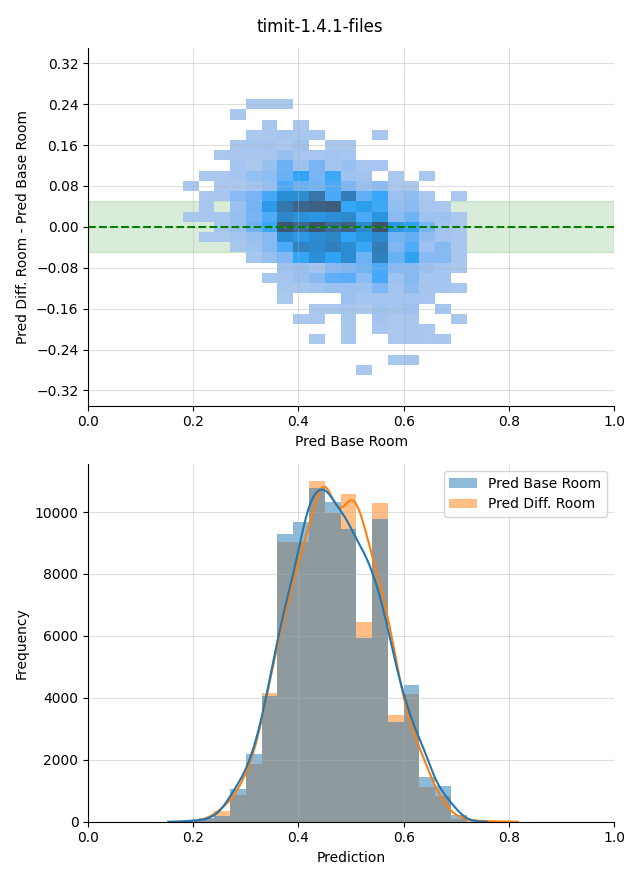
timit-1.4.1-files |
0.62 |
mean |
0.65 |
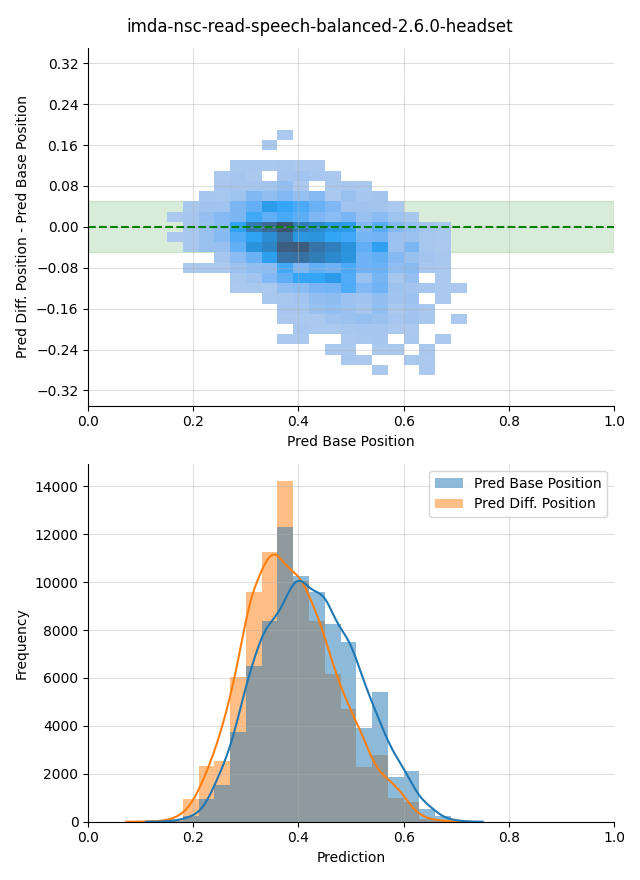
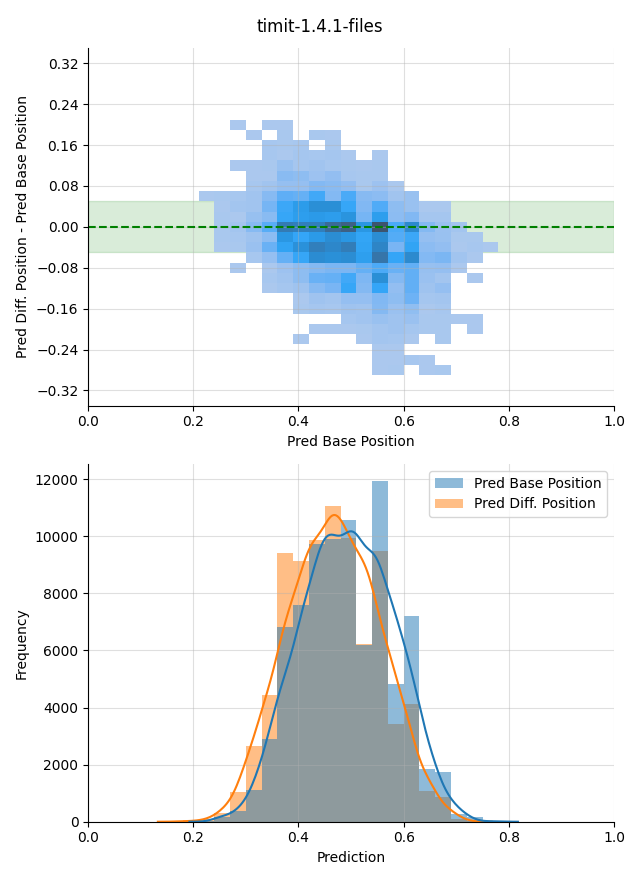
Visualization Simulated Position
Difference of predictions for audio with a baseline simulated position and audio with a different simulated position. The allowed prediction difference \(\delta < 0.05\) is highlighted in green in the upper plot. The lower plot shows the distributions of the two predictions.
Visualization Simulated Room
Difference of predictions for audio with a baseline simulated room and audio with a different simulated room. The allowed prediction difference \(\delta < 0.05\) is highlighted in green in the upper plot. The lower plot shows the distributions of the two predictions.
