Correctness speaker ranking
12.5% passed tests (1 passed / 7 failed).
Spearmans Rho
Data |
anger |
happiness |
neutral |
sadness |
|---|---|---|---|---|
meld-1.3.1-emotion.categories.test.gold_standard |
-0.60 |
0.37 |
-0.31 |
-0.26 |
msppodcast-2.6.0-emotion.categories.test-1.gold_standard |
-0.94 |
-0.26 |
0.20 |
0.37 |
mean |
-0.77 |
0.05 |
-0.05 |
0.05 |
Visualization
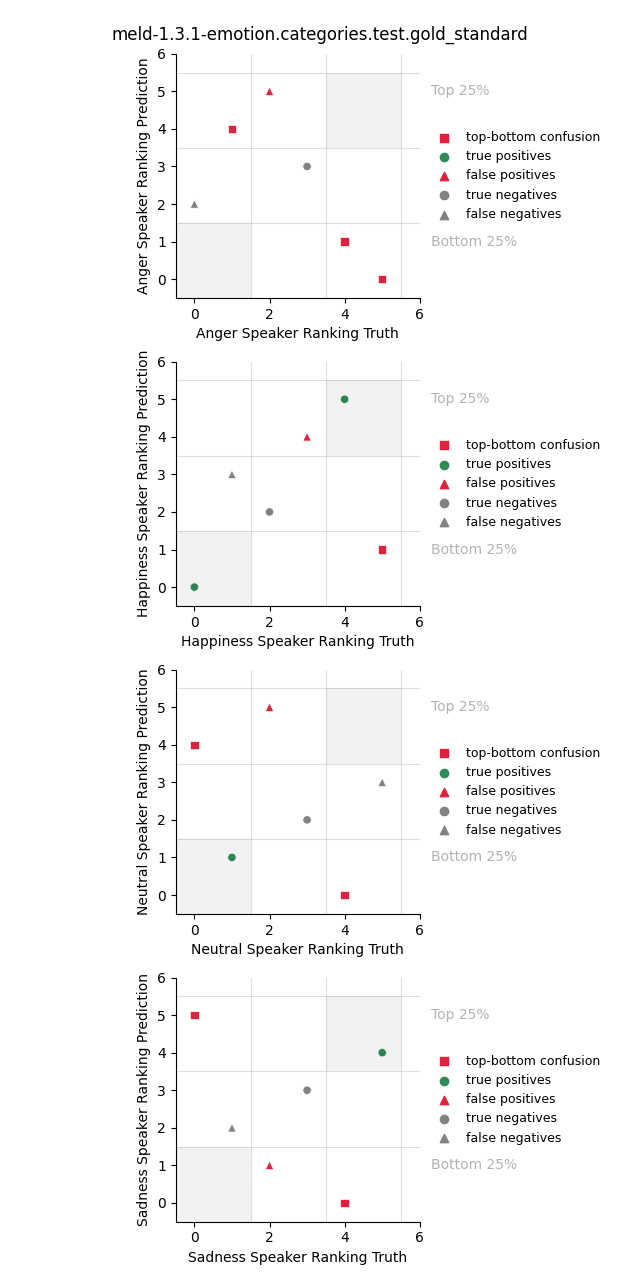
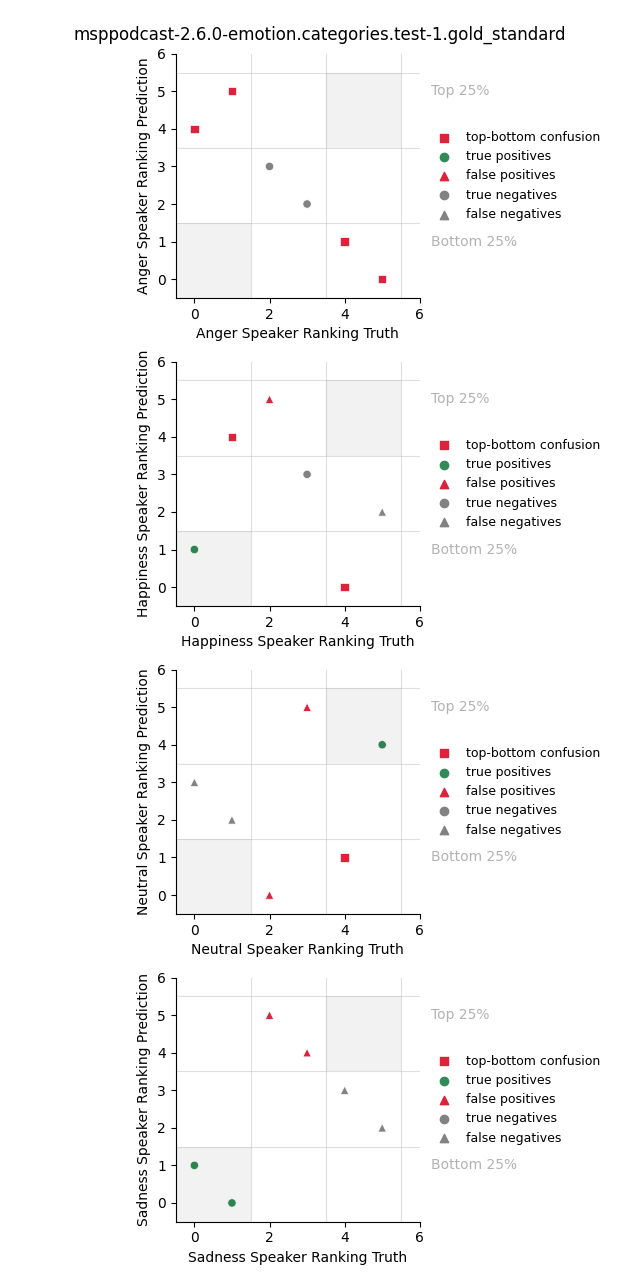
The plots visualize the precision of predicting speakers to be in the Top 25% or Bottom 25% of all speakers for each class in respect to the proportion of samples of that class. Green dots indicate correctly classified speakers, red false positive speakers, whereby red squares indicate confusions between Top 25% and Bottom 25% speakers. The remaining grey data points are samples outside the range of interest. They contain false negatives that should have been predicted in the Top 25% or Bottom 25% of speakers, but were not. True negatives are those speakers that are not part of the Top 25% or Bottom 25%, and were predicted as such.

