Correctness speaker average
33.3% passed tests (4 passed / 8 failed).
Class Proportion Mean Absolute Error
Data |
anger |
happiness |
neutral |
sadness |
|---|---|---|---|---|
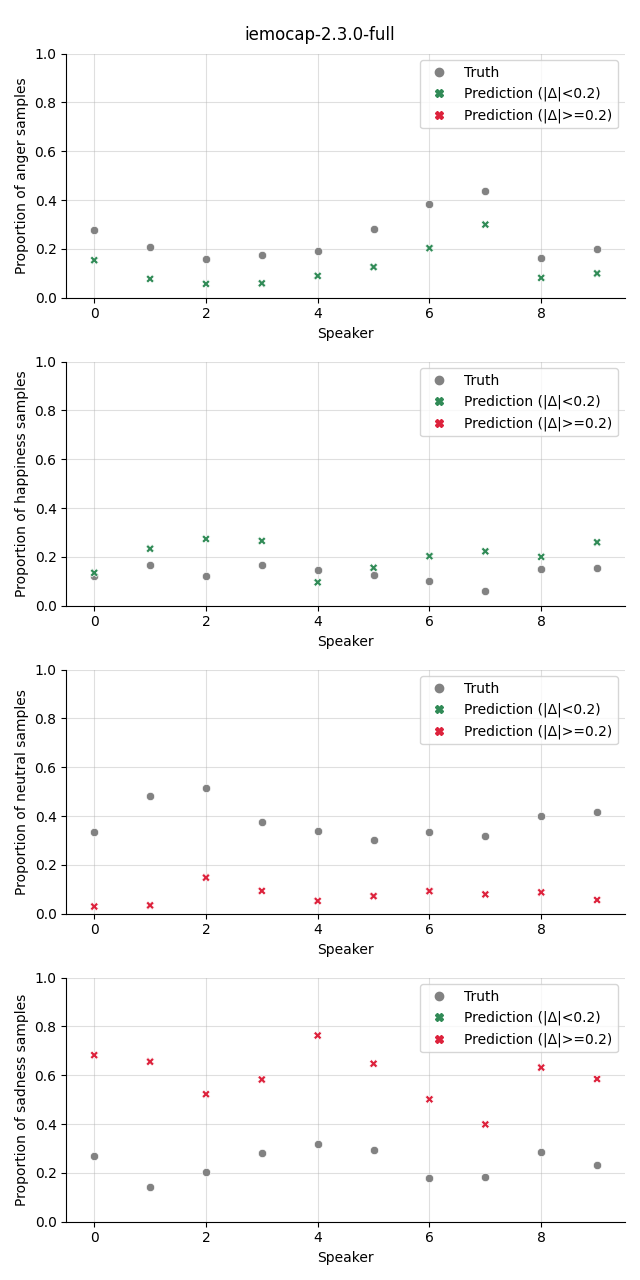
iemocap-2.3.0-full |
0.12 |
0.08 |
0.31 |
0.36 |
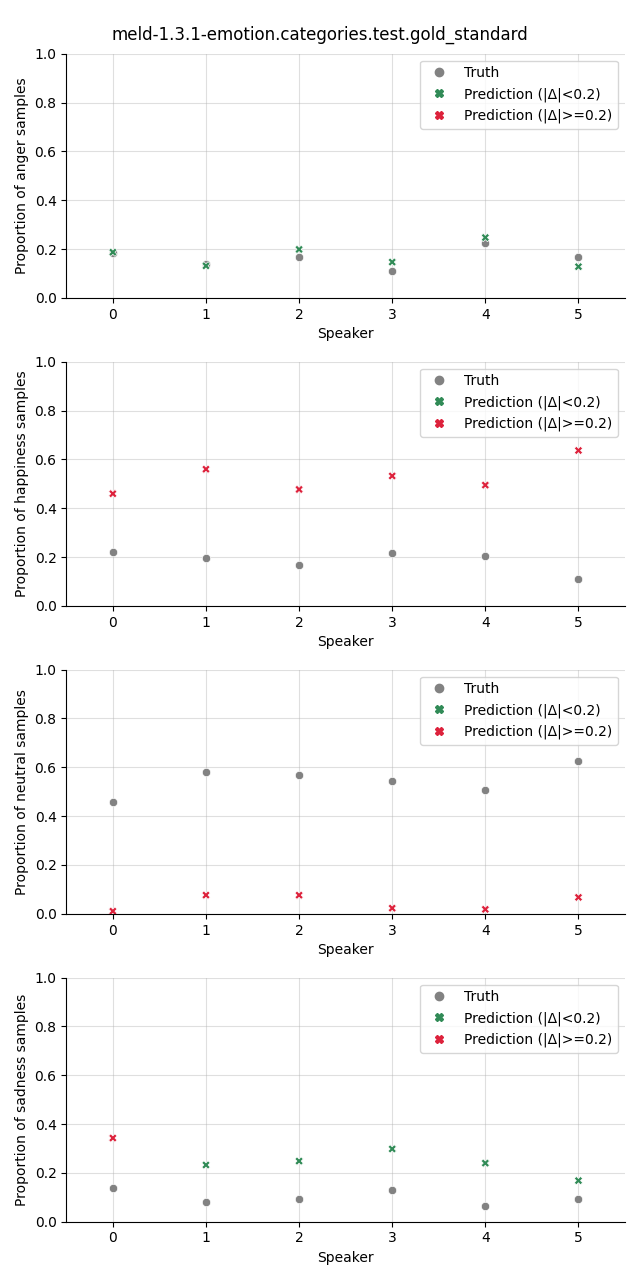
meld-1.3.1-emotion.categories.test.gold_standard |
0.02 |
0.34 |
0.50 |
0.15 |
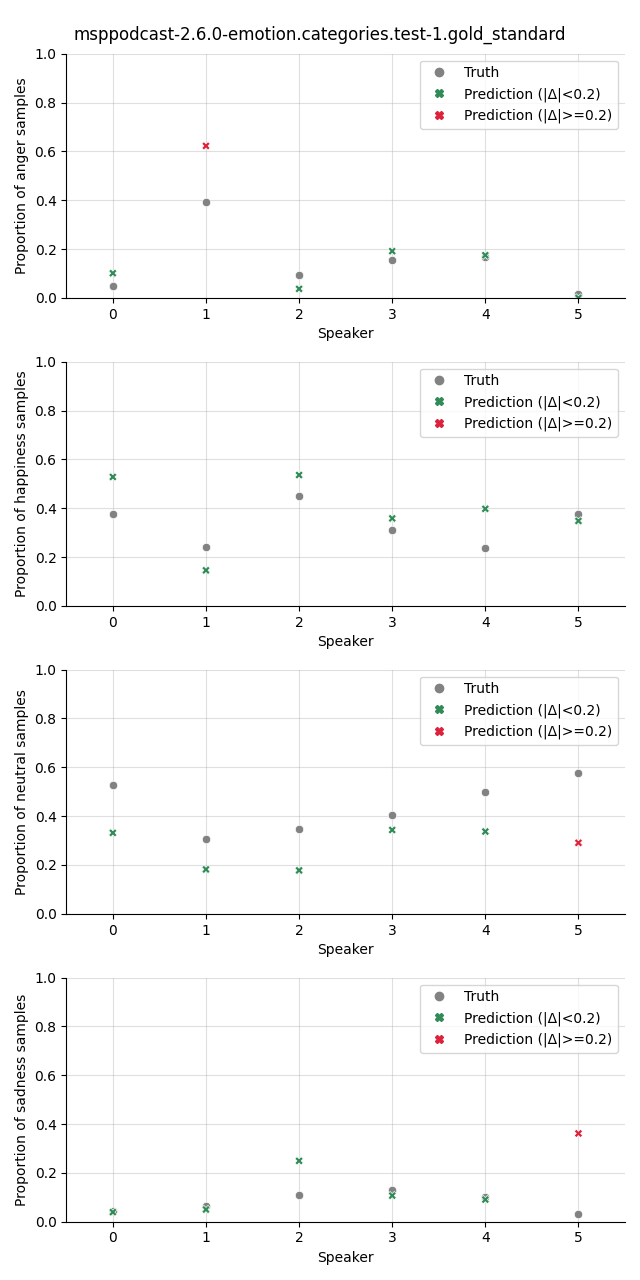
msppodcast-2.6.0-emotion.categories.test-1.gold_standard |
0.07 |
0.10 |
0.17 |
0.09 |
mean |
0.07 |
0.17 |
0.33 |
0.20 |
Visualization
The plot shows the proportion of the predicted samples for each class, as well as the true proportion of the class. We select a slightly higher threshold for the absolute error in the plots compared to the Class Proportion Difference test as we are interested in highlighting only big deviations here.


