Correctness consistency
51.2% passed tests (22 passed / 21 failed).
Samples In Expected High Range
Proportion of samples whose predictions fall into the expected value range of >= 0.55
Data |
anger |
|---|---|
crema-d-1.2.0-emotion.categories.test.gold_standard |
0.87 |
danish-emotional-speech-1.1.1-emotion.test |
0.90 |
emodb-1.2.0-emotion.categories.test.gold_standard |
1.00 |
emovo-1.2.1-emotion.test |
1.00 |
iemocap-2.3.0-emotion.categories.test.gold_standard |
0.91 |
meld-1.3.1-emotion.categories.test.gold_standard |
0.98 |
polish-emotional-speech-1.1.1-emotion.categories.test.gold_standard |
1.00 |
ravdess-1.1.2-emotion.speech.test |
1.00 |
mean |
0.96 |
Samples In Expected Low Range
Proportion of samples whose predictions fall into the expected value range of <= 0.45
Data |
fear |
sadness |
|---|---|---|
crema-d-1.2.0-emotion.categories.test.gold_standard |
0.42 |
0.87 |
danish-emotional-speech-1.1.1-emotion.test |
0.48 |
|
emodb-1.2.0-emotion.categories.test.gold_standard |
0.03 |
1.00 |
emovo-1.2.1-emotion.test |
0.14 |
0.75 |
iemocap-2.3.0-emotion.categories.test.gold_standard |
0.12 |
0.75 |
meld-1.3.1-emotion.categories.test.gold_standard |
0.04 |
0.18 |
polish-emotional-speech-1.1.1-emotion.categories.test.gold_standard |
0.40 |
0.82 |
ravdess-1.1.2-emotion.speech.test |
0.06 |
0.75 |
mean |
0.17 |
0.70 |
Samples In Expected Neutral Range
Proportion of samples whose predictions fall into the expected value range of [0.3, 0.6]
Data |
happiness |
neutral |
surprise |
|---|---|---|---|
crema-d-1.2.0-emotion.categories.test.gold_standard |
0.85 |
0.88 |
|
danish-emotional-speech-1.1.1-emotion.test |
0.98 |
1.00 |
1.00 |
emodb-1.2.0-emotion.categories.test.gold_standard |
0.22 |
1.00 |
|
emovo-1.2.1-emotion.test |
0.62 |
0.98 |
0.74 |
iemocap-2.3.0-emotion.categories.test.gold_standard |
0.88 |
0.95 |
|
meld-1.3.1-emotion.categories.test.gold_standard |
0.60 |
0.68 |
0.56 |
polish-emotional-speech-1.1.1-emotion.categories.test.gold_standard |
0.22 |
1.00 |
|
ravdess-1.1.2-emotion.speech.test |
0.59 |
1.00 |
0.12 |
mean |
0.62 |
0.94 |
0.60 |
Visualization
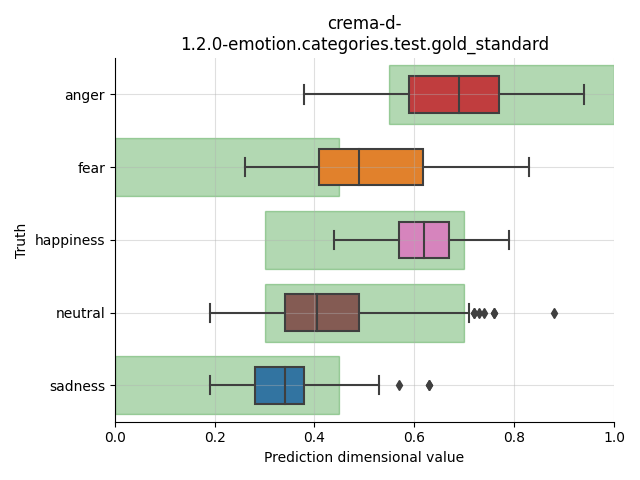
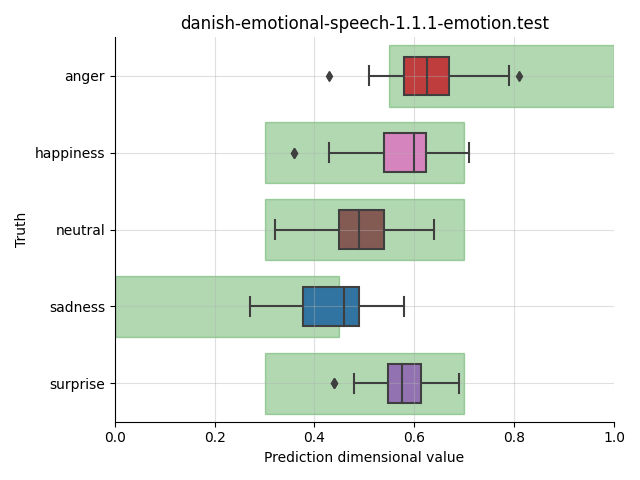
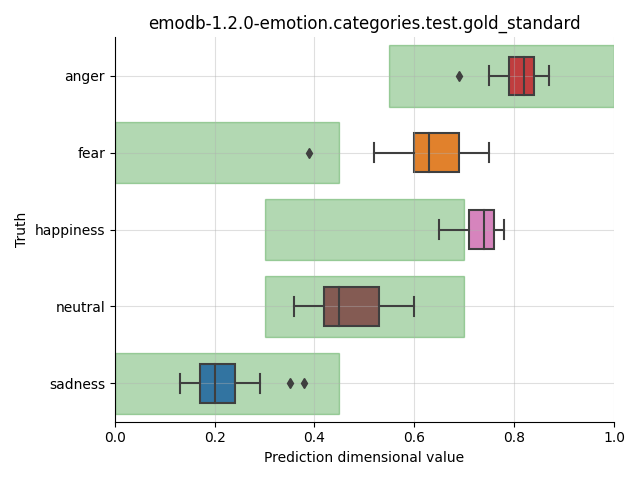
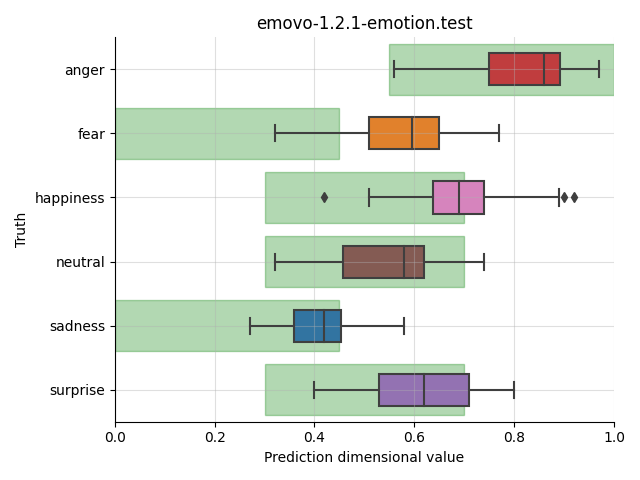
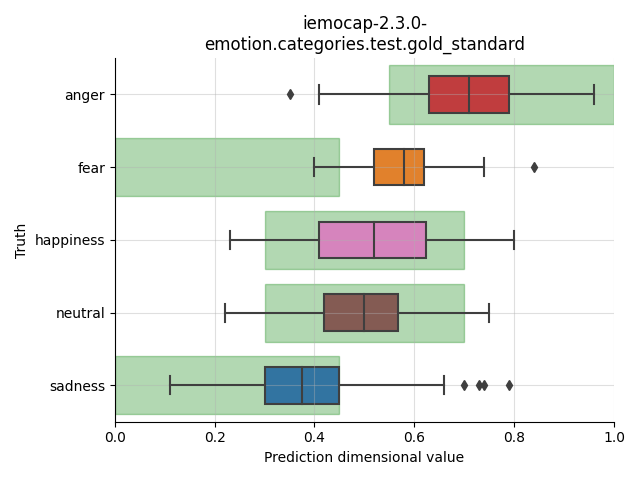
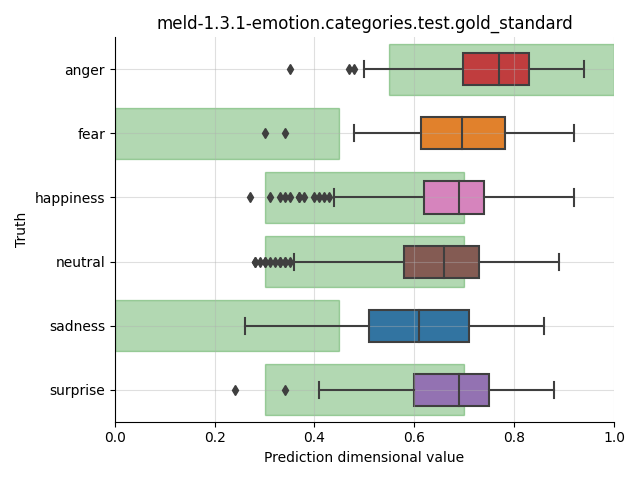
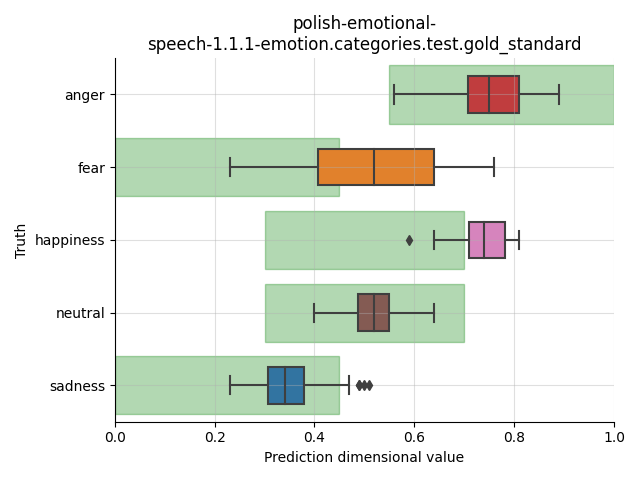
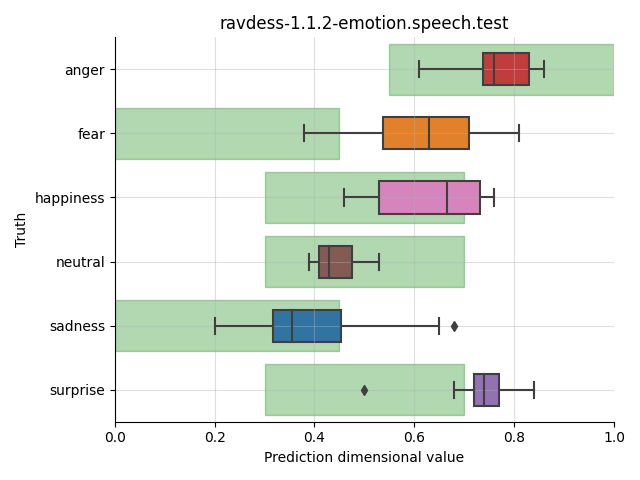
Distribution of dimensional model predictions for samples with different categorical emotions. The expected range of model predictions is highlighted by the green brackground.
