Robustness background noise
45.8% passed tests (11 passed / 13 failed).
Change Ccc Babble Noise
Data |
Change CCC Babble Noise |
|---|---|
iemocap-2.3.0-emotion.dimensions.test.gold_standard |
0.04 |
msppodcast-2.6.1-emotion.dimensions.test-1.gold_standard |
-0.03 |
mean |
0.01 |
Change Ccc Coughing
Data |
Change CCC Coughing |
|---|---|
iemocap-2.3.0-emotion.dimensions.test.gold_standard |
0.04 |
msppodcast-2.6.1-emotion.dimensions.test-1.gold_standard |
-0.03 |
mean |
0.01 |
Change Ccc Environmental Noise
Data |
Change CCC Environmental Noise |
|---|---|
iemocap-2.3.0-emotion.dimensions.test.gold_standard |
0.02 |
msppodcast-2.6.1-emotion.dimensions.test-1.gold_standard |
-0.04 |
mean |
-0.01 |
Change Ccc Music
Data |
Change CCC Music |
|---|---|
iemocap-2.3.0-emotion.dimensions.test.gold_standard |
0.01 |
msppodcast-2.6.1-emotion.dimensions.test-1.gold_standard |
-0.03 |
mean |
-0.01 |
Change Ccc Sneezing
Data |
Change CCC Sneezing |
|---|---|
iemocap-2.3.0-emotion.dimensions.test.gold_standard |
0.04 |
msppodcast-2.6.1-emotion.dimensions.test-1.gold_standard |
-0.03 |
mean |
0.01 |
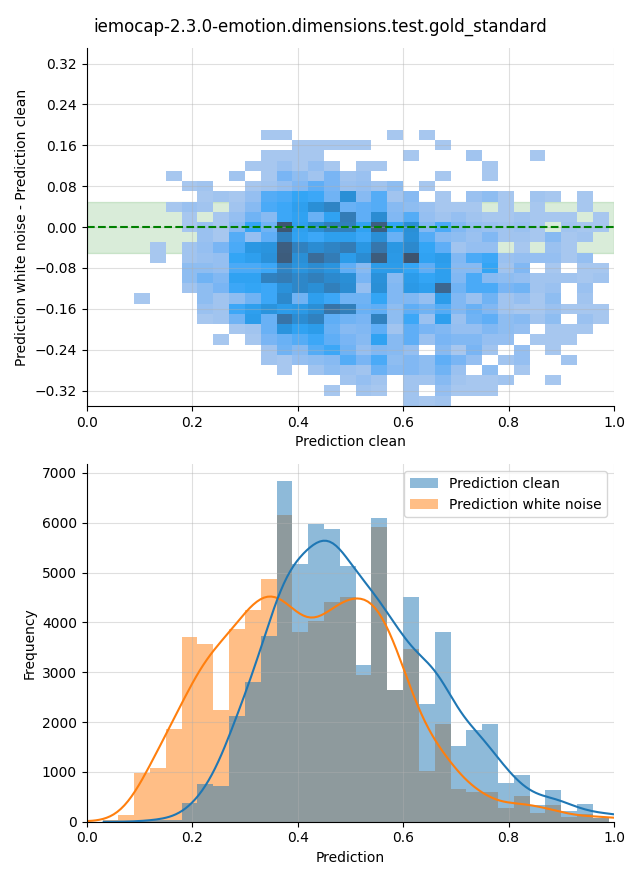
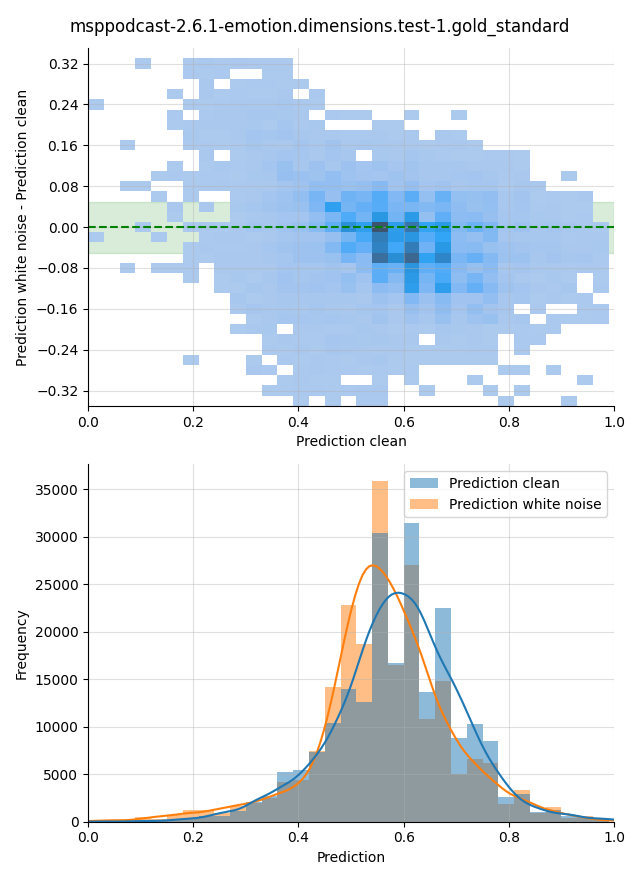
Change Ccc White Noise
Data |
Change CCC White Noise |
|---|---|
iemocap-2.3.0-emotion.dimensions.test.gold_standard |
0.00 |
msppodcast-2.6.1-emotion.dimensions.test-1.gold_standard |
-0.08 |
mean |
-0.04 |
Percentage Unchanged Predictions Babble Noise
Data |
Percentage Unchanged Predictions Babble Noise |
|---|---|
iemocap-2.3.0-emotion.dimensions.test.gold_standard |
0.70 |
msppodcast-2.6.1-emotion.dimensions.test-1.gold_standard |
0.73 |
mean |
0.71 |
Percentage Unchanged Predictions Coughing
Data |
Percentage Unchanged Predictions Coughing |
|---|---|
iemocap-2.3.0-emotion.dimensions.test.gold_standard |
0.71 |
msppodcast-2.6.1-emotion.dimensions.test-1.gold_standard |
0.84 |
mean |
0.77 |
Percentage Unchanged Predictions Environmental Noise
Data |
Percentage Unchanged Predictions Environmental Noise |
|---|---|
iemocap-2.3.0-emotion.dimensions.test.gold_standard |
0.67 |
msppodcast-2.6.1-emotion.dimensions.test-1.gold_standard |
0.71 |
mean |
0.69 |
Percentage Unchanged Predictions Music
Data |
Percentage Unchanged Predictions Music |
|---|---|
iemocap-2.3.0-emotion.dimensions.test.gold_standard |
0.67 |
msppodcast-2.6.1-emotion.dimensions.test-1.gold_standard |
0.72 |
mean |
0.70 |
Percentage Unchanged Predictions Sneezing
Data |
Percentage Unchanged Predictions Sneezing |
|---|---|
iemocap-2.3.0-emotion.dimensions.test.gold_standard |
0.67 |
msppodcast-2.6.1-emotion.dimensions.test-1.gold_standard |
0.79 |
mean |
0.73 |
Percentage Unchanged Predictions White Noise
Data |
Percentage Unchanged Predictions White Noise |
|---|---|
iemocap-2.3.0-emotion.dimensions.test.gold_standard |
0.30 |
msppodcast-2.6.1-emotion.dimensions.test-1.gold_standard |
0.47 |
mean |
0.39 |
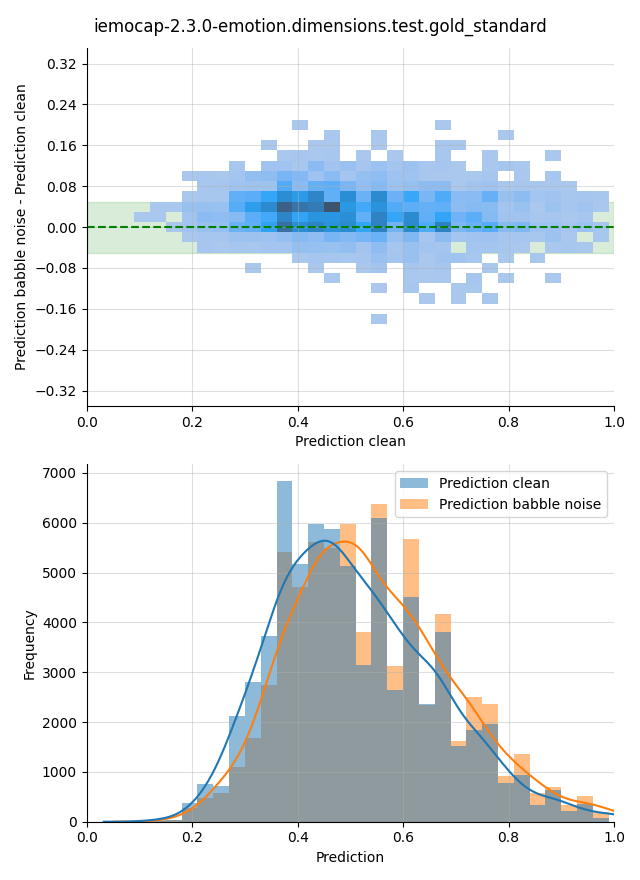
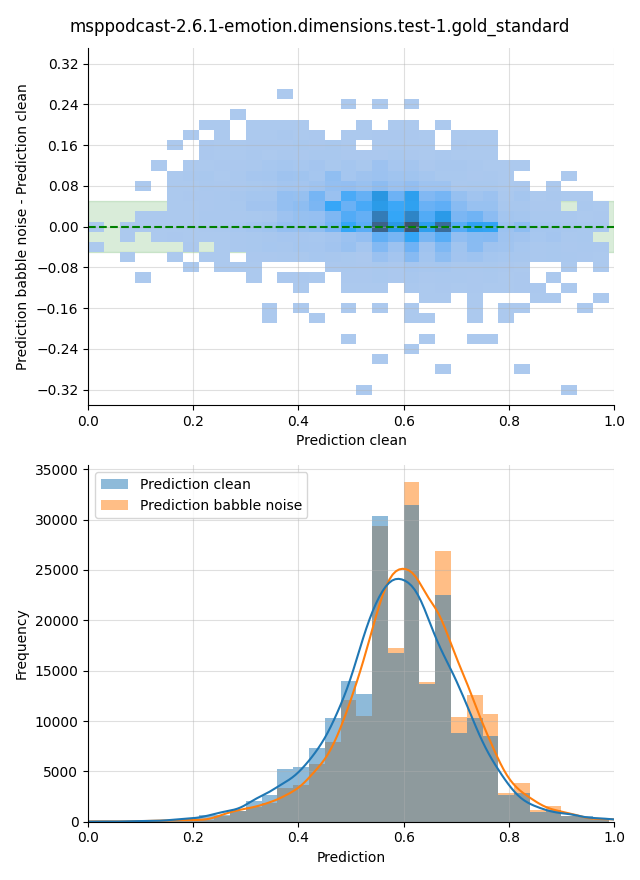
Visualization Babble Noise
Difference of predictions for clean audio and audio with added babble noise. The allowed prediction difference \(\delta < 0.05\) is highlighted in green in the upper plot. The lower plot shows the distributions of the two predictions.
Visualization Coughing
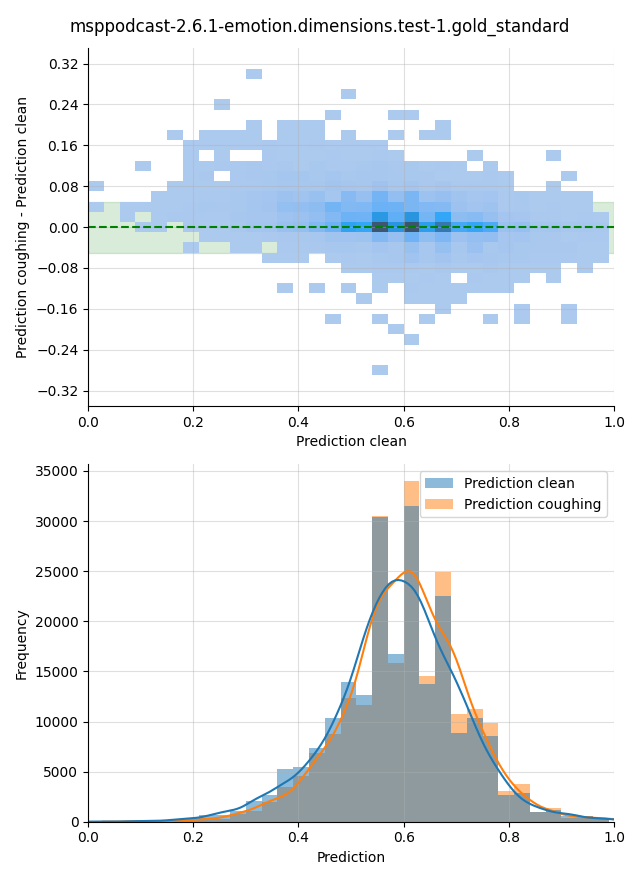
Difference of predictions for clean audio and audio with added coughing. The allowed prediction difference \(\delta < 0.05\) is highlighted in green in the upper plot. The lower plot shows the distributions of the two predictions.

Visualization Environmental Noise
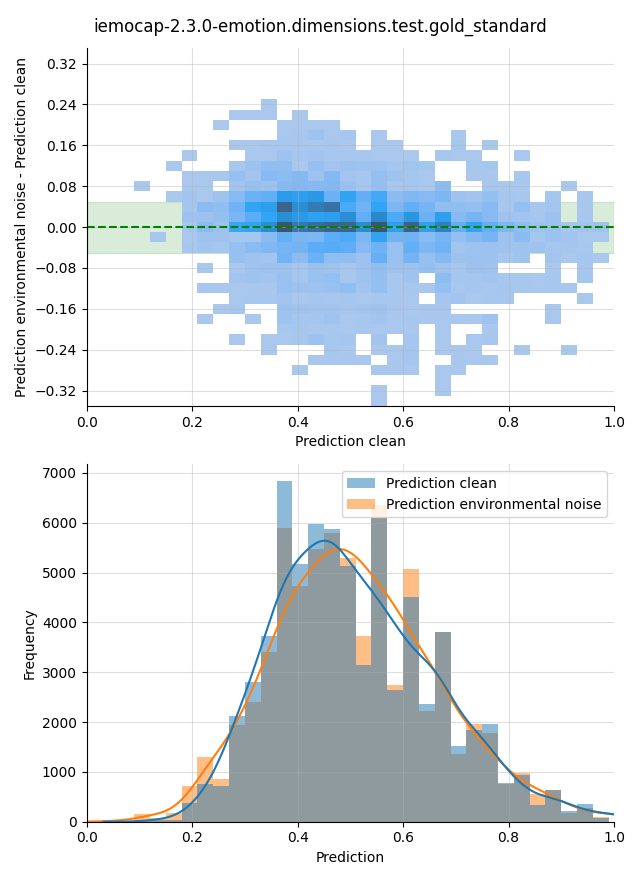
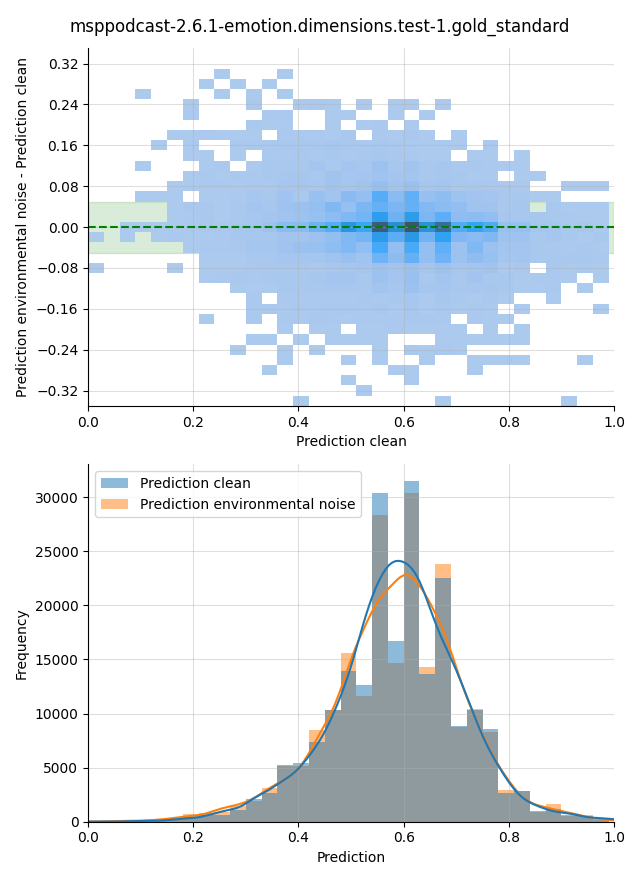
Difference of predictions for clean audio and audio with added environmental noise. The allowed prediction difference \(\delta < 0.05\) is highlighted in green in the upper plot. The lower plot shows the distributions of the two predictions.
Visualization Music
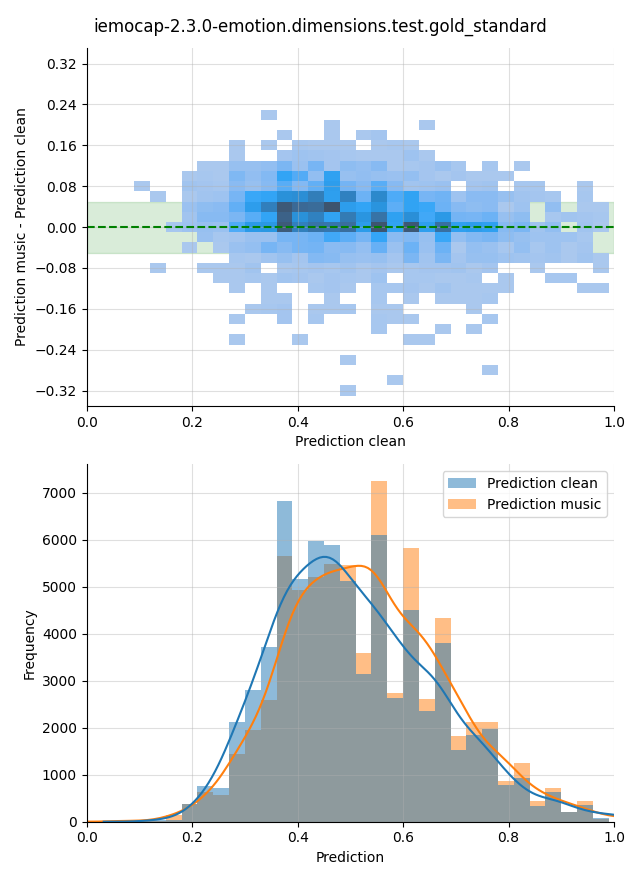
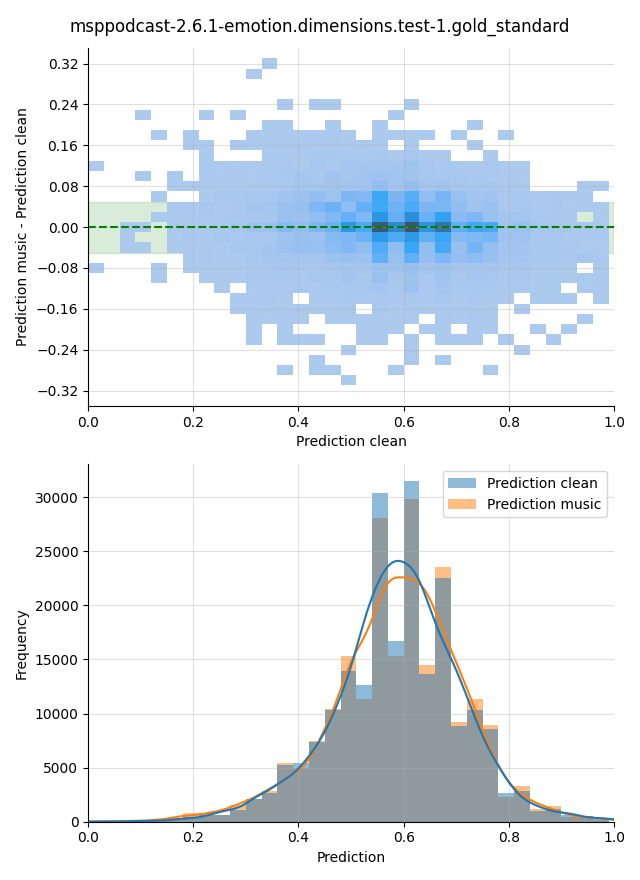
Difference of predictions for clean audio and audio with added music. The allowed prediction difference \(\delta < 0.05\) is highlighted in green in the upper plot. The lower plot shows the distributions of the two predictions.
Visualization Sneezing
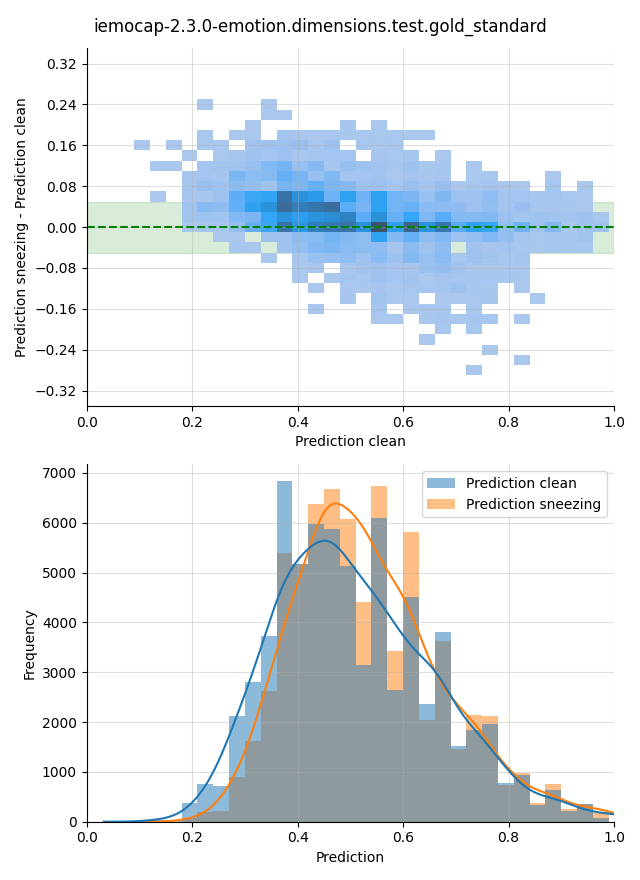
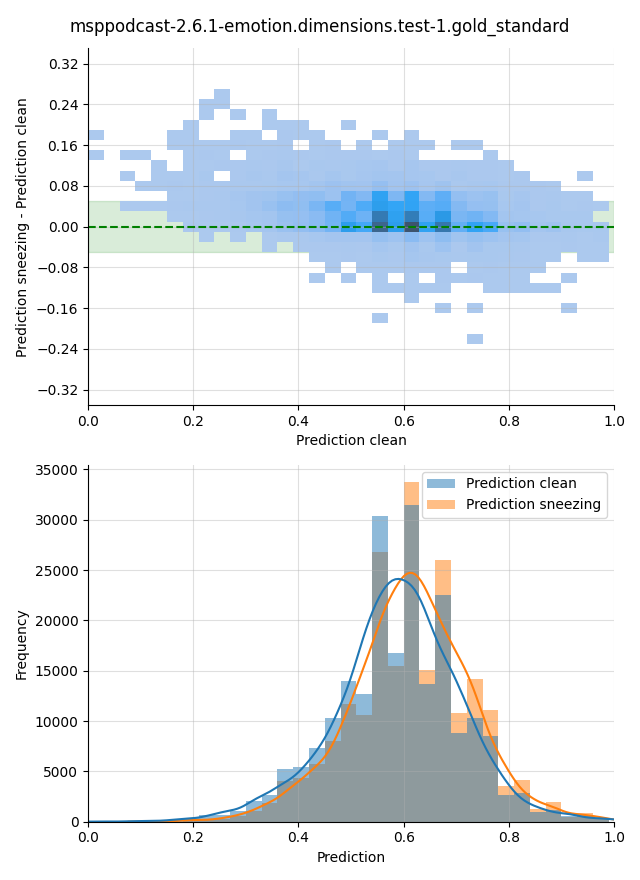
Difference of predictions for clean audio and audio with added sneezing. The allowed prediction difference \(\delta < 0.05\) is highlighted in green in the upper plot. The lower plot shows the distributions of the two predictions.
Visualization White Noise
Difference of predictions for clean audio and audio with added white noise. The allowed prediction difference \(\delta < 0.05\) is highlighted in green in the upper plot. The lower plot shows the distributions of the two predictions.
